HOT
Toolmaster
Contact us:
TEL: +086-010-50951355 / FAX:+86-010-50951352
Email : cathy@souvr.com / Frank@souvr.com / Robin@souvr.com / sales@souvr.com
Details
Related
Consulting
※Product Overview※
Toolmaster
Toolmaster is the most comprehensive toolset available for visual data analysis and presentation under X Windows and an excellent foundation for adding graphics to Windows applications.
Toolmaster provides X and Windows developers with a cross-platform library of more than 500 C/C++ and FORTRAN functions for scientific, technical and commercial graphics.

Portable Graphics Library for C/C++ Programmers
Toolmaster agX is the preferred cross-platform graphics library by leading software houses and in-house application development teams around the world. For FORTRAN programmers, AVS offers FGL/AGL, which provides equivalent functionality to the agX C library.
The Toolmaster agX library of more than 500 C functions extends the underlying window system with application graphics and presentation-quality hardcopy, supporting a wide range of data formats and chart types through a high-level API.
Even without X or Windows programming experience, you can quickly add sophisticated graphics to your applications, and can integrate Toolmaster agX functions with Windows GUI builders to further reduce application development time.
Seamless Integration for X and Windows
Toolmaster agX provides application portability across a range of platform and operating system architectures encompassing desktop machines to supercomputers. All Toolmaster agX functions are fully implemented and compatible across UNIX/Linux, Windows, and Windows NT (Windows compilers supported through 32 bit DLL). Toolmaster agX is regularly updated to the latest OS and system software versions, providing programmers with an up-to-date graphics environment from which to develop cross-platform production applications.
All Toolmaster graphics transform into drawing primitives optimized for the selected window system. Further, you can build highly interactive applications by combining agX graphics with window- and event-handling operations.
Developer and Deployment Friendly
• Comprehensive set of application-level functions for 2D and 3D data presentation.
• Complete developer control over all chart layout and appearance parameters.
• Open event loop for interactive application development with X and Windows.
• Presentation-quality hardcopy and metafile output.
• UNIX/Linux and Windows availability.
• Proven at more than 1,500 customer sites worldwide.
• Gsharp is AVS’s solution for end-user technical data analysis and presentation and is based on Toolmaster.
Application Modules

GRAPHICS: System kernel containing functions for initialization, scaling, color system, graphics contexts, drawing primitives, and hardcopy rendering.
AXES: Advanced axis modeling system supporting a wide range of 2D and 3D axis types including linear, logarithmic, polar, power, date/time, and user labeled axes.
BLOCKS: 3D irregular data and volume data display as 3D and 4D block diagrams. Support for undefined data values allows display of the data set interior.
CHARTS: Powerful 2D and 3D charting package for financial, engineering, and scientific charts with precise user control over all chart attributes. Includes functions for data interpolation.
CGM: Industry leading implementation of the ISO standard computer graphics metafile. CGM generator and interpreter supports all 3 metafile encodings. A built-in profile system ensures smooth metafile interchange.
CONTOURS: Color shaded contours, grids, and isolines in 2D, 3D, and 4D. Full user control of mesh interval, line attributes, isoline annotation, view angle, and legend.
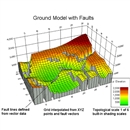
CONTOURS+: Advanced contouring features, including isoline feathering, faults and barriers, regions, and user-defined grid spacing.
FLOWMAPS: Graphical display of multi-dimensional data represented by arrows, rose glyphs, or any symbol from the character library, with symbol mapping at minimum and maximum thresholds.
GRIDS: Functions for quick visual analysis of irregular and regular data as 2D scatter and grid displays, or 3D and 4D grid displays. Select average, minimum, or maximum value for shading multiple points in a cell.
IMAGE: Vertical and horizontal display of image data, real or integer, with no limits on number of colors. Provides optimal mapping to image, cell array, or rectangle drawing primitive on selected output device.
INTERPOLATIONS: Numerical methods for transforming scatter data into regular gridded data. Includes grid refinement and regridding functions.
PROJECTIONS: Data conversion between common cartographic projections using double precision arithmetic. Supports Azimuthal Stereographic, Gnomonic, Lambert Conformal Conic, Mercator, and UTM projections.
3D RENDER: Software rasterizer for displaying 3D geometry data as constant or Gouraud shaded objects with light source, or as wireframes. Useful for adding geometry to numerical data displays.
VOLUMES: Volume data rendering as isosurfaces, threshold volumes, or cutting planes. Includes 3D data interpolation methods.
Special Seismic Modules
SEISPLOT: Seismic data display as wiggle lines, variable area, and interpolated background charts. Complete user control of annotation including fill direction, trace interval, line attributes, and trace numbers.
CGM Seismic: Seismic industry extensions to CGM. Supports both CGM+ and CGM*PIP metafile formats.


