Subsurface Data Management and Reporting Software-gINT Logs
Contact us:
TEL: +086-010-50951355 / FAX:+86-010-50951352
Email : cathy@souvr.com / Frank@souvr.com / Robin@souvr.com / sales@souvr.com
Details
Related
Consulting
※Product Overview※
Subsurface Data Management and Reporting Software
Go beyond your basic logs with gINT Professional. You can report and manage subsurface data in almost any way with custom reports including graphics, photos, charts, maps, and more. The software helps you manage borehole, well logs, CPT, and geophysical logs. You can also create fence diagrams, graphs, tables, and any other imaginable report.

gINT Professional enables you to:
• View subsurface data from Google Earth
• Publish data in Web-based GIS
• Visualize subsurface data in ArcGIS
• Import/Export gINT reports into design, modeling, and analysis software such as Bentley’s civil applications or AutoCAD

Because everyone has different needs and requirements, gINT provides multiple applications.
• gINT Logs offers high-end boring and well log data management and reporting
• gINT Professional builds on the data management and reporting capabilities of gINT Logs and allows you to use the same data to create fence diagrams, graphs, tables, and virtually any other imaginable report
• gINT Professional Plus takes gINT to the next level with SQL Server support for efficient, centralized data management and powerful multi-project reporting

CAPABILITIES
Create and visualize geotechnical reports
Virtually create any type of subsurface report – including borehole and well logs, fence diagrams, cross sections/profiles, site maps, graphs, and tables – all from the same data. Standardize reports with advanced report design tools for conditional formatting, data manipulation, and decision making.
Create fence diagrams
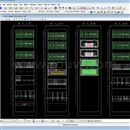
Display data from various boring logs in a single report with 2D/3D fence diagrams. Use smart fence diagrams to adjust to the presence or absence of data. Extract surface data, convert to a grid and then display on fence diagrams. Depict features in elevation on your fence report with graphics.
Create geotechnical borehole logs
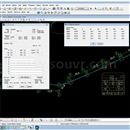
Jump-start with log reports provided with gINT installation, or design log reports to match your organization’s conventional paper logs. Add intelligence and data-sensitivity to your log reports with a rich set of log report properties and embedded expressions.
Create geotechnical well logs
Customize your well logs with ease. Plot basic wells and complex well lithology diagrams, lab and field tests, geological information, or any other required data. Create smart reports that display columns when specified data is available.
Create specialized geotechnical reports
Expand your report library to comprise nine types of reports in addition to the standard reports including logs, fences/profiles, graphs, histograms, graphic tables, text tables, graphic text documents, text documents, and site maps. You can also design your own, including both field and lab variety reports.
Interoperate with engineering applications
Save data in a non-proprietary format readily available for reuse by subsurface data consumers such as civil engineers, structural/bridge engineers, and geotechnical engineers for their designs. Import and export data via customary formats such as Excel, CSV, Microsoft Access, AGS, LandXML.
Manage subsurface data
Use subsurface data management tools for data acquisition, validation, queries, reporting, and data sharing among stakeholders on a project level. Geotechnical, geoenvironmental, geology, and mining professionals can use subsurface data via a user-friendly interface.
Work with geotechnical subsurface data in 3D
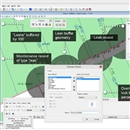
Display gINT subsurface data in 3D, boreholes, lithology, water level, and more. Load data directly from gINT projects and display using different color themes. Combine subsurface data with existing ground survey for comprehensive analysis.


